Products
Applications
Learning
 Part of the Oxford Instruments Group

In drug discovery and development, NMR spectrometry plays a pivotal role in the analysis of molecular structures. NMR screening methods offer a reliable and valuable tool for the identification of small molecules and hit-to-lead optimization. Typically, a library of compounds is screened for ‘hits’ (e.g. particular ligands) that can bind to a specific target. NMR binding assays can then be used to validate the hits and advance them for further potential development. This is however an application typically limited to higher field NMR instruments.
Benchtop NMR comes into its own at the later stages in the drug development and in the manufacturing process where, accurate identification of small molecules continues to be an important factor. All drug products must meet the standards of an approved ‘reference standard’, and it is common for NMR to provide the information required to create these standards, as well as being applied in-process to ensure intermediates and end products consistently meet them.
In many cases, a simple one-dimensional hydrogen spectrum can quickly confirm a structure based on the chemical shift, peak splitting, and integral value. For simple small molecules, much of this analysis can be automated with standard routines. If the molecule is more complex, some signals may overlap in the one-dimensional spectrum; a high-performance benchtop NMR spectrometer such as X-Pulse can provide a range of one-dimensional and two-dimensional experiments to enable structural confirmation and even whole molecule structural elucidation for unknowns.
As an example, the molecular structure of the drug gemfibrozil (IUPAC name: 5-(2,5-dimethylphenoxy)-2,2-dimethyl-pentanoic acid, empirical formula: C15H22O3) is shown at the top left of Figure 1. As a member of the fibrate class of molecules, it regulates blood lipids, reducing triglycerides and LDL cholesterol levels, while increasing HDL levels, lowering the risk of heart disease. Figure 1 shows the one-dimensional hydrogen spectrum (top), fully decoupled carbon spectrum (left side), and two-dimensional 1H-13C HSQC spectra. In the HSQC spectrum, plotted as a contour map, peaks can be seen at the chemical shift coordinates corresponding to the shift of a hydrogen nucleus and the carbon nucleus to which it is bonded (arrows in the diagram show examples). A 1H-13C HMBC spectrum can be used to assign longer-range through-bond correlations between hydrogen and carbon nuclei in the molecule. By combining data obtained from these spectra, the molecule’s characteristic peaks can be clearly identified and the molecular structure of the active end product confirmed.
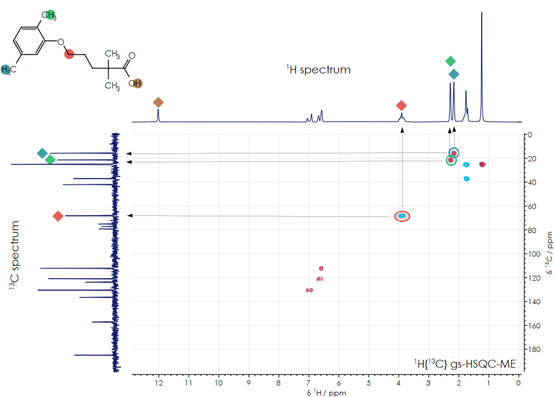
Figure 1. Gemfibrozil 1D and 2D NMR spectra
Read our application note to learn more about confirming and understanding your candidate molecules or reaction intermediates with benchtop NMR.

© Oxford Instruments 2026