Applications
Learning
 Part of the Oxford Instruments Group

Process development identifies the parameters used for synthesis, manufacturing and stability testing, often generating data to support the filing process with pharmaceutical regulatory bodies. NMR is used extensively in the structural characterisation of intermediates, final products and impurities. Cryogen free benchtop NMR spectroscopy additionally elucidates chemical pathways and optimises the synthesis process for the drug target molecule.
The synthesis process of small molecule pharmaceuticals often involves multi-step organic chemical reactions. When the structure of a target intermediate or the location of a characteristic NMR peak is known, complete structure elucidation becomes unnecessary. For these intermediate process reactions, simple detection and identification of characteristic peaks quickly determines the presence of expected intermediates and products, saving time, effort, and money.
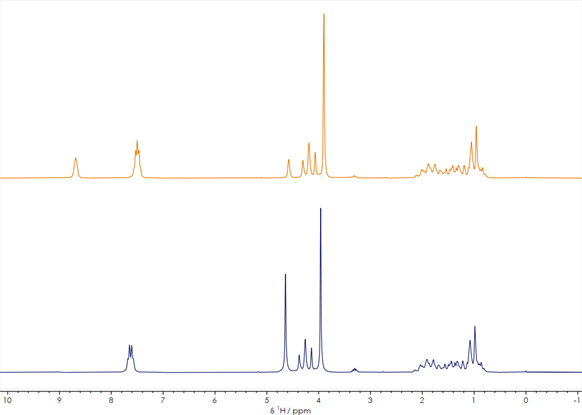
Figure 1. One-dimensional 1H stacked spectra of a reaction mixture before and after reaction
Fluorine is a high sensitivity NMR active nucleus that is often even more powerful for reaction monitoring than the more commonly used hydrogen. The less complex fluorine NMR spectra and the wider chemical shift dispersion allow easy resolution of reactant and product signals. ¹⁹F NMR provides crucial information for a wide range of pharmaceuticals including the many new APIs containing fluorine. Figure 2 shows two stacked ¹⁹F spectra before (orange spectrum) and after (blue spectrum) a synthetic process. The change is obvious, with a new peak appearing in the spectrum after the reaction, indicating the addition of another type of fluorinated group to the molecule. With simple one-dimensional spectra like these, X-Pulse can quickly provide screening results in any standard laboratory.
In drug development and production, while knowing the identities of reactants and products is crucial, so is understanding of the reaction process and kinetics. To study and monitor reactions, a benchtop X-Pulse NMR can be equipped with a flow chemistry module that connects directly to an external reaction vessel. The reaction mixture is continuously pumped through the flow cell for real-time online monitoring of chemical reactions.
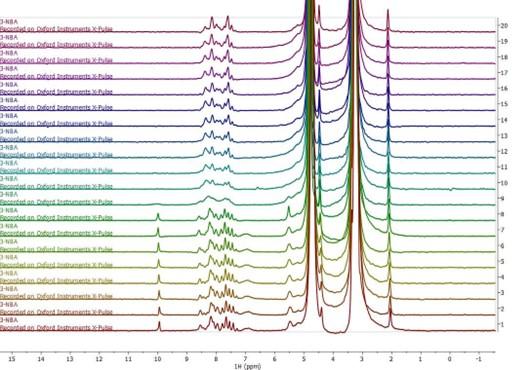
Figure 3. Stacked series of one-dimensional 1H NMR spectra acquired during online monitoring of the reduction of 3-nitrobenzaldehyde to 3-nitrobenzyl alcohol
Figure 1 shows two one-dimensional 1H spectra of a compound before (orange spectrum) and after (blue spectrum) the synthesis process. The spectra each with ̴ ̴1 minute acquisition time clearly provide sufficient signal to noise to make critical decisions about the synthesis. The overall peak shapes of the two 1H spectra are very similar, especially in the 0-5 ppm region. However, the different chemical shifts and splitting patterns of the characteristic peaks in the 7-9 ppm region indicate that the compound has been chemically altered in the reaction. Further spectral analysis using database matching or comparison with predicted spectra, in conjunction with information about reactant structures, the reaction mechanism, and the process flow, can determine whether the product is an expected intermediate or a different compound.
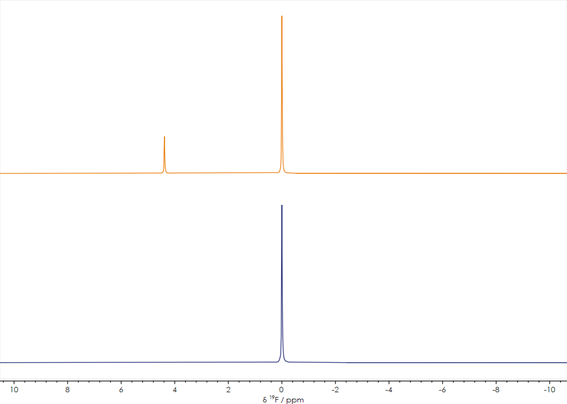
Figure 2. One-dimensional ¹⁹F NMR spectra acquired before (lower) and after completion of (upper) a reaction (spectra unreferenced)
3-nitrobenzaldehyde is an important intermediate in the synthesis of Nitrendipine, Nimodipine and Nicardipine in the pharmaceutical industry. Using a sodium borohydride catalyst, 3-nitrobenzaldehyde can be reduced to 3-nitrobenzyl alcohol. The flow rate is continuously pumped into the X-Pulse NMR flow cell every 20 s and a 1H spectrum is recorded. Figure 3 shows the results of online monitoring of the chemical reaction using a one-dimensional 1H spectrum. The reaction mixture was pumped continuously through the flow cell at a rate of 1 ml/min, and a spectrum was acquired every 20 seconds. The aldehyde group of the reactant, located at approximately 10 ppm, completely disappeared in the tenth spectrum, acquired approximately 200 seconds after the reaction was initiated. This indicates that the reaction process was very rapid. In addition, in the ninth spectrum, the resolution of the benzene ring region, located between approximately 7-9 ppm, suddenly deteriorated, likely indicating formation of an intermediate product with a medium rate of exchange on the NMR timescale. Later spectra still lack the aldehyde peak, while showing a higher resolution benzene ring region, suggesting that the reaction had gone to completion.
Through benchtop NMR online monitoring of chemical reactions, the concentration curves of reactants and products over time can be obtained. Using this data, the order and rate constant of the chemical reaction can be determined. If the chemical reaction rate constants under different temperature conditions can be obtained, then the enthalpy, entropy and Gibbs free energy changes and other kinetic parameters of the reaction can be calculated. This provides valuable information for optimizing reaction conditions, improving reaction efficiency, controlling the reaction process, and designing reactors.
For more information
© Oxford Instruments 2026