Products
Applications
Learning
 Part of the Oxford Instruments Group
Introduction
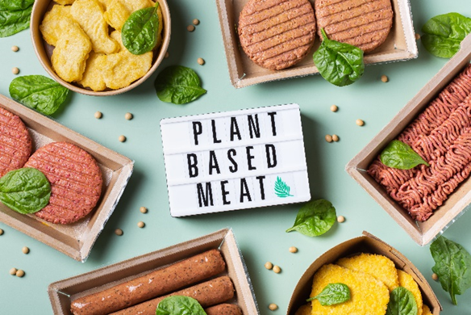
Meat analogue products based on plant protein sources have been widely considered a rich replacement for conventional meat. The main reason for the increased interest in meat analogues is public awareness of a healthier diet and, above all, a sustainable environment (less greenhouse gas emissions and depletion of natural resources). However, mimicking the sensory texture and mouthfeel attributes is still a key challenge in this topic. Therefore, adequate instrumental techniques are required to better understand and characterise plant-based meat matrices and consequently correlate them with sensory analysis.
Time Domain NMR (TD-NMR)
Time-domain NMR (TD-NMR) is a versatile technique for measuring food sample composition and, more broadly, quality control in a range of industries. It has also been successfully used to investigate water and fat distribution in animal meat products for many decades and has recently been applied to plant-based meat (PBM). [1,2] Furthermore, TD-NMR is a non-destructive tool and benefits from excellent repeatability, high accuracy, and reliability

Relaxometry Analysis in Food Science
Most of the TD-NMR research on food samples is based on relaxometry methods, which are widely used to analyse the composition and distribution of water and fat. T2 (transverse relaxation time) is the primary relaxation parameter used in food analysis. It is commonly measured using the Carr-Purcell-Meiboom-Gill (CPMG) sequence, which relies on a 90º pulse followed by a train of 180º pulses to generate a train of echoes.
The intensities of these echoes decay over time, describing the T2 decay. The other relaxation time is the longitudinal one (T1), which is commonly measured by the Inversion Recovery (IR) sequence and combined with CPMG in the 2D methods (IR-CPMG) to obtain the T1-T2 correlation.
In food samples, the T2 decay is generally described by multi-exponential components related to fat and water proton* content. The T2 value may range from microseconds to seconds depending on the type of fat, water content, and the environment in which the water protons are confined. In a typical food sample, the water protons correspond to more than one T2 component, representing distinct “classes” of proton-bearing water populations, which have much faster T2 relaxation than free water.[3] The longest T2 relaxation time is assigned to a fraction with the highest level of proton mobility, while the shortest one represents the water protons strongly bound to other ingredients or confined within the food matrix.
Relaxometry Analysis of meat/meat analogues
TD-NMR has been widely used in the food processing industry to investigate water-protein interactions. This has provided insights into several macroscopic properties, such as water-holding capacity (WHC), which describes the capability of the protein to retain the water inside the pores, fat and water content, and textural properties changes during cooking and storage stages.[3]
1H T2 distribution from 15 to 75 ºC
This study investigated the water and fat distribution of two soya-based burgers under heating conditions (15 - 75ºC) using MQC-R and a 1H 18 mm liquid variable temperature probe. Nutrition information per 100 g of each burger is compiled in Table 1. The raw CPMG (T2) decays were acquired on both samples and then processed using a1D inverse Laplace transformation (ILT).
Figure 1 shows samples A and B’s T2 distribution time (1D-ILT) as the temperature increases from 15°C to 75°C. For sample A, containing 19% fat content, the number of components and the relative area increased by raising the temperature. In addition, the T2 relaxation time shifts gradually to longer values at higher temperatures. Those changes may be related to structural transformation with the heating, as they are primarily caused by physico-chemical events, such as fat crystal melting (and maybe separation from water), shrinkage, and fluid expulsion.
Sample B, with lower fat content (6%), shows a different T2 distribution profile than A, indicating a distinct structure and water/lipid partitioning behaviours under similar heating conditions. In general, T22 and T23 in sample B are shorter than in A (Figure 2), suggesting a tighter structure and less water mobility in the protein matrix of burger B. This statement is supported in the following section with the 2D experiment.
To better visualise which component may be affected by the lipids content, the CPMG (T2) decay of coconut oil was acquired at 45ºC. As shown in Figure 3, components T23 and T24 are more likely to represent not only water but also the lipid’s protons, reinforced in the 2D maps. However, T21 and T22 are more closely associated with water protons. According to the literature, T2b has also been assigned to the protein-bound protons [1,2]. Previous studies have also reported four components [2] for a blend of different plant proteins and five components for plant-based analogues [1].
T1 -T2 maps from 15 to 75 ºC
IR-CPMG experiments were conducted and processed using the NMR ProLab software by Green Imaging, a straightforward approach to obtain the T1-T2 maps using the 2D ILT processing method.
T1-T2 maps agree with the 1D-T2 distribution but have more detailed information.
2D maps (Figure 4) show that the T22 component for the PBM A is a combination of T2 of two components, while in the PBM B, the T22 seems to overlap three components. This shows that T1-T2 maps are helpful in studying more complex systems where multiple components overlap.
The diagonal line is associated with a T1/T2 ratio equal to 1. As the signals go to the left of this line, the T1/T2 ratio becomes higher. The higher T1/T2 for PBM B at 75 ºC indicates that the mobility of water protons is more restricted in PBM B. This suggests that water has weaker mobility in PBM B, i.e., its structure is more rigid, supporting the T2 distribution data.
Summary
This study demonstrates the potential of TDNMR to explore the structural changes during simulation of the “cooking process” of plant-based meat analogue burgers, which has the potential to help improve the sensory experience of plant-based products.
Category: Application Note
