Introduction
There is a growing importance in the use of automation in laboratory environments, for example the use of Materials Acceleration Platforms (MAPs), automating both experiments and subsequent analysis. In order to obtain reliable results from these automated experiments, the experimental parameters such as the actual composition of samples require verification.
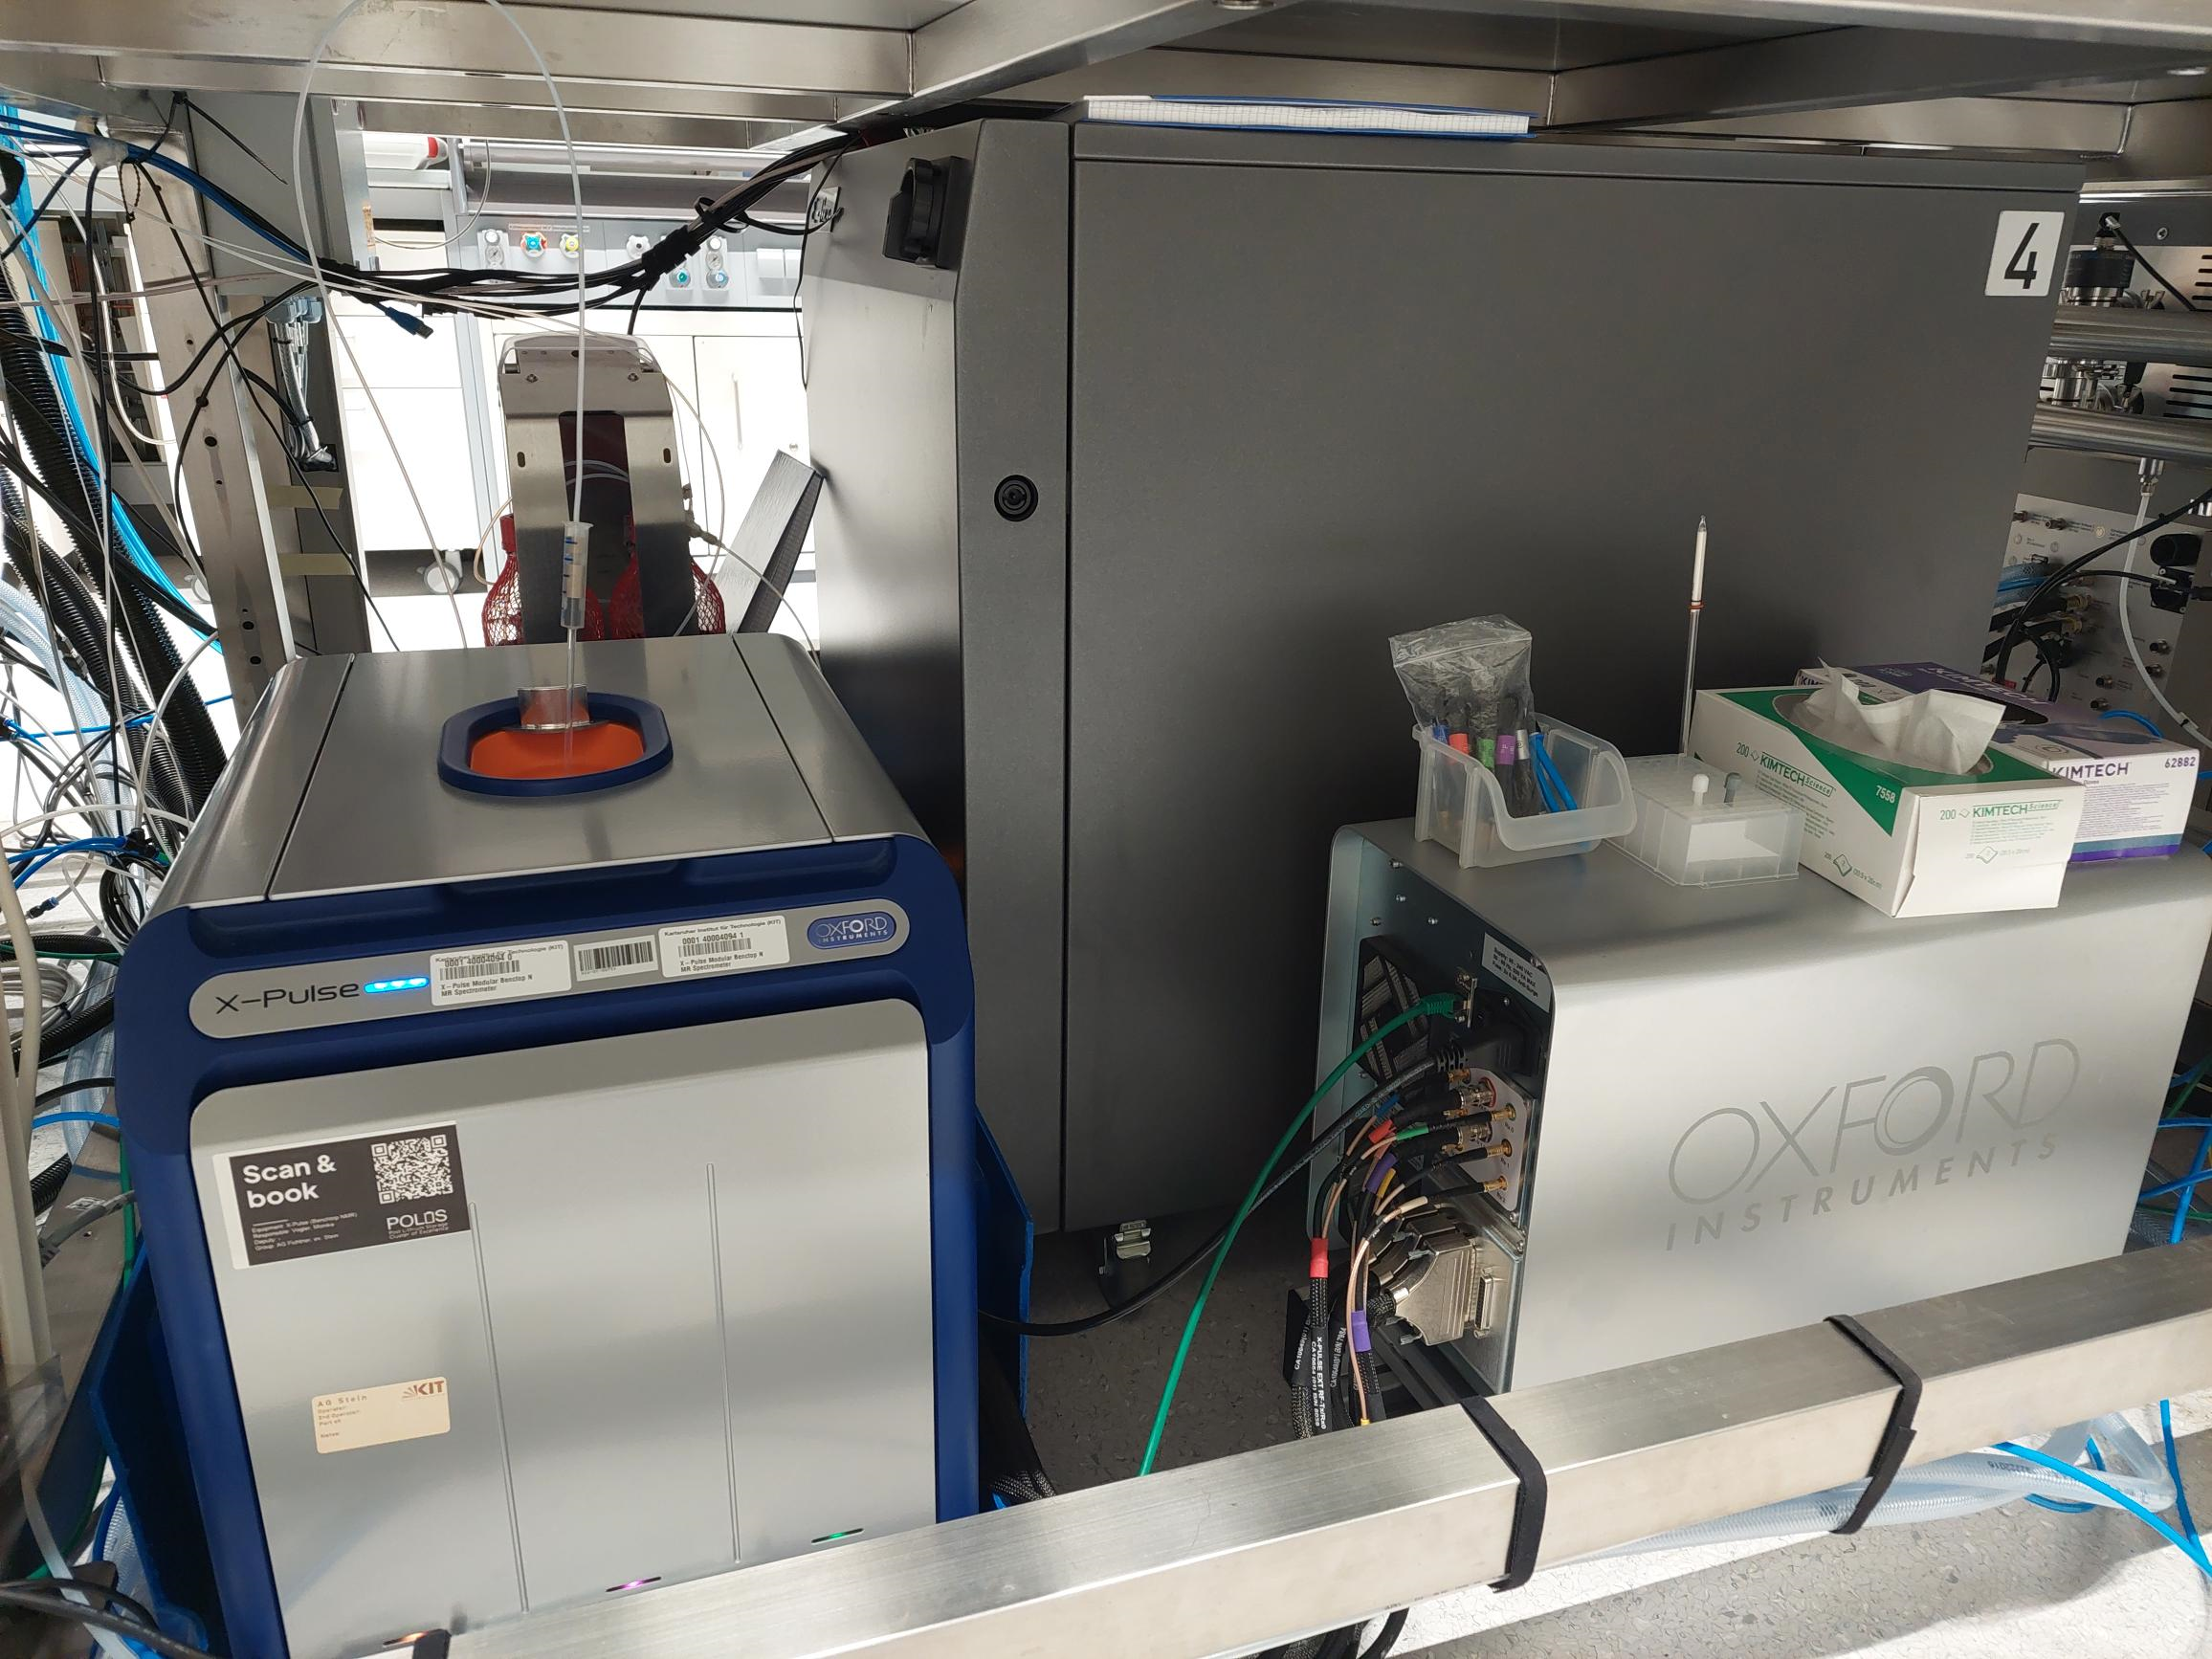
NMR spectroscopy is a powerful technique for the analysis of a wide range of sample compositions. Oxford Instruments X-Pulse family of Benchtop NMR Spectrometers are ideal for these measurements, due to their multinuclear capability, support for measurements in flow, and stability in a wide range of environments. This report demonstrates a use case, in which an X-Pulse 60 Broadband Benchtop NMR Spectrometer is used for the automated acquisition of NMR spectra largely in a flow setup: for samples of lithium- & sodium-ion battery electrolytes. These measurements allow for examination of the actual sample compositions, and determination of the self-diffusion coefficients of the various components (knowledge of which is important to aid understanding of the performance of the resulting batteries).
Experimental
The samples used in this case are solutions of the salts sodium hexafluorophosphate, Na[PF6], lithium hexafluorophosphate, Li[PF6], and lithium bis(trifluoromethanesulfonyl)imide, Li[TFSI], each dissolved in a mixture of 70% ethyl methyl carbonate (EMC) and 30% ethylene carbonate (EC); liquid electrolytes commonly used in lithium-ion and sodium-ion batteries. The stock solutions containing each of the salts have concentrations of 1 mol/ℓ. Binary salt solutions were formulated from these solutions by combining appropriate amounts of two single salt solutions using a flow chemistry setup.
Measurements were manually triggered and performed using an Oxford Instruments X-Pulse 60 Broadband Benchtop NMR Spectrometer. Using standard NMR tubes made of borosilicate glass (outer diameter 5.0 mm, inner diameter 4.0 mm). Or in a flow configuration where a fluorinated ethylene propylene (FEP) tube (outer diameter 4.8 mm, inner diameter 3.2 mm) is fed through the probe of the spectrometer, allowing for the samples to be directly flowed into the instrument. In both cases measurements were performed on static (non-flowing) samples.
The X-Pulse has a 2H external lock, which avoids the need to add reference substances to the samples, which would be impractical within automated workflows. In this case, such additions are especially problematic as the samples are intended for further use after performing the NMR measurements.
A comparative analysis between the spectra recorded using the NMR tubes and the flow configuration is performed with respect to the observed signals, the composition of the samples and the self-diffusion coefficients of selected species.
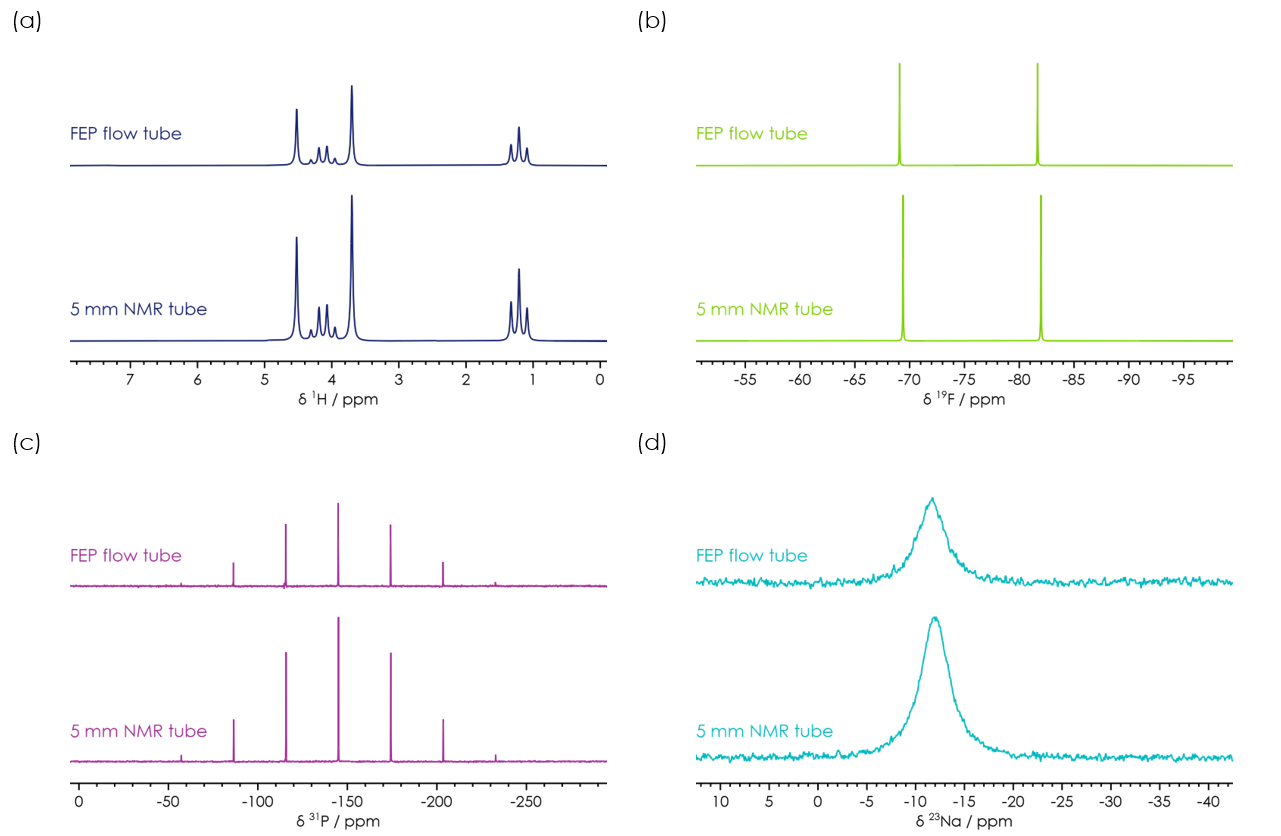 Figure 1: A comparison of NMR spectra recorded for a sample of 1 mol/ℓ Na[PF6] in 3:7 EC:EMC. The spectra are shown for static sample in both a standard 5 mm diameter NMR tube and in the FEP flow tube.
Results
Observed signals
Despite the simple setup of the flow configuration used in this study, the recorded NMR spectra shown in Figure 1 capture the relevant features that allow for their analysis in this use case. It needs to be noted that the intensity of the spectra measured in the flow setup is lower than the one achieved with the NMR tubes; this isn’t unexpected due to the reduced internal diameter (and hence volume of sample in the detection region) for the FEP flow tube compared with a standard NMR tube.
Composition analysis
Verification of sample composition is standard practice in conventional laboratory experiments and is equally essential in automated workflows to ensure accurate reporting and traceability of results. In this study, three binary electrolyte samples were automatically formulated from 1 mol/ℓ Li[PF6] and 1 mol/ℓ Li[TFSI] stock solutions in 3:7 EC:EMC and then flowed into the spectrometer. The compositions determined from quantitative 19F and 1H NMR spectra acquired using the X-Pulse 60 in its flow configuration are summarised in Tables 1 & 2.
The 19F derived ratios (Table 1) deviate significantly from the target values, particularly at higher Li[PF6] fractions. This most likely indicates a loss of the Li[PF6] solution within the flow setup during the formulation process, leading to deviations in the formulations. These demonstrate the utility of online NMR for detecting formulation errors. Researchers can therefore use NMR-verified compositions in subsequent data analysis or exclude samples that exhibit unacceptable deviations. Moreover, this provides actionable diagnostic information, enabling the optimisation of pump operation or detection of system malfunctions such as leaks or backflow.
Table 1: The composition of automatically formulated binary salt electrolyte solutions containing Li[PF6] and Li[TFSI] in 3:7 EC:EMC; determined by quantitative 19F NMR spectra recorded on the X-Pulse 60 using a FEP flow tube.
| Salt |
molar ratio Li[PF6]/Li[TFSI] / mol/mol |
| set |
determined |
| 20 Li[PF6] : 80 Li[TFSI] |
0.25 |
0.17 |
| 50 Li[PF6] : 50 Li[TFSI] |
1.0 |
1.14 |
| 80 Li[PF6] : 20 Li[TFSI] |
4.0 |
7.33 |
Table 2: The composition of automatically formulated binary salt electrolyte solutions containing Li[PF6] and Li[TFSI] in 3:7 EC:EMC; determined by quantitative 1H NMR spectra recorded on the X-Pulse 60 using a FEP flow tube.
| Salt |
molar ratio Li[PF6]/Li[TFSI] / mol/mol |
| set |
determined |
| 20 Li[PF6] : 80 Li[TFSI] |
0.507 |
0.525 |
| 50 Li[PF6] : 50 Li[TFSI] |
0.507 |
0.522 |
| 80 Li[PF6] : 20 Li[TFSI] |
0.507 |
0.511 |
However, the ratios presented in Table 2, that were determined from 1H spectra of the same samples, show that the deviations in the solvent ratio are significantly smaller than the ones observed for the salts. This indicates that the large deviations obtained from the 19F spectra are likely to originate from errors in the pumping system when formulating the samples rather than from insufficient performance of the NMR measurements that use the flow setup.
Table 3: Comparison of self-diffusion coefficients D[PF6]-, D[TFSI]-, and DLi+ of the [PF6]-, [TFSI]-, and Li+ ions in the electrolyte formulations determined using 19F and 7Li PGSE NMR measurements performed on static samples in standard NMR tubes, or in the FEP flow tube.
| Sample |
D / x10-10 m2/s |
| [PF6]- |
[TFSI]- |
Li+ |
| Li[PF6] |
5 mm NMR tube |
4.13 ± 0.001 |
- |
3.03 |
| Li[PF6] |
FEP flow tube |
4.17 ± 0.02 |
3.35 |
2.96 |
| Li[TFSI] |
5 mm NMR tube |
- |
3.51 |
2.92 |
| Li[TFSI] |
FEP flow tube |
- |
3.46 |
2.91 |
| |
|
|
3.64 |
2.96 |
| Na[PF6] |
5 mm flow tube |
4.51 ± 0.001 |
- |
- |
| Na[PF6] |
FEP flow tube |
4.41 ± 0.009 |
- |
- |
| 20 Li[PF6] : 80 Li[TFSI] |
FEP flow tube |
3.72 ± 0.1 |
3.39 |
2.82 |
| 50 Li[PF6] : 50 Li[TFSI] |
FEP flow tube |
3.92 ± 0.07 |
3.50 |
2.83 |
| 80 Li[PF6] : 20 Li[TFSI] |
FEP flow tube |
4.23 ± 0.01 |
3.68 |
2.98 |
Self-diffusion coefficients
Table 3 shows the self-diffusion coefficients D[PF₆]⁻, D[TFSI]⁻, and DLi⁺ for the [PF6]–, [TFSI]–, and Li+ ions, respectively. Each of them was determined from Pulsed-field Gradient Spin Echo (PGSE) NMR measurements using both standard NMR tubes and also for static samples in the flow configuration. The values obtained from the measurements in NMR tubes are in good agreement with the ones determined in the flow configuration. The data does not show a systematic over- or underestimation in either method. The values of D[PF₆]⁻ in the binary salt electrolytes increase for higher Li[PF6] content and reach a value comparable to the one of the single-salt Li[PF6] electrolyte for the volumetric mixing ratio of the Li[PF6] solution to the Li[TFSI] solution of 80:20. The trend in D[TFSI]⁻ cannot be understood based on this reasoning. Also, DLi⁺ does not show a trend with the Li[PF6] concentration.
In table 3 it is noticeable that signals corresponding to Li[TFSI] are observed in the 19F spectra obtained using the flow configuration for a sample that is supposed to contain Li[PF6] as the only salt. This indicates that residue from a previous Li[TFSI] containing sample remained in the tube. Consequently, it can be deduced that the cleaning procedure needs to be improved to achieve sufficient draining of the samples and avoid cross-contamination.

Conclusion
It can be concluded that the spectra obtained from measurements using both standard NMR tubes and the flow configuration, using the Oxford Instruments X-Pulse 60 Broadband Benchtop NMR Spectrometer are comparable, with the only significant difference, the lower intensity for the flow setup, due to the reduced sample volume in the detection region. The quality of the spectra recorded with the flow setup is sufficient for the purpose of this study showing all the relevant signals. The information regarding the composition of the samples and the self-diffusion coefficients of various ions agree reasonably well between the two configurations for the measurement. Consequently, the simple flow configuration described in this report is suitable for the purpose of this use case. Based on these results, the integration of the X-Pulse 60 within automated research platforms seems promising to incorporate inline verification in the platforms and extend their analysis capabilities.
Summary
The results in this case study, demonstrate that the X-Pulse can be effectively integrated into automated research platforms to provide inline verification of sample composition and ion transport properties, supporting robust, automated experimentation.
The work was performed using the X-Pulse 60, which already provides the flexibility, stability, and broadband performance needed for automated workflows and integration into materials acceleration platforms. It shows how benchtop NMR can deliver quantitative, reproducible data on composition and diffusion. Now with the X-Pulse 90, we’re able to take those same capabilities even further. The higher field strength offers improved sensitivity and signal dispersion, while maintaining the same modular, broadband architecture and FlowNMR compatibility. This means measurements can now be performed faster, with greater spectral clarity.
† Helmholtz-Institute Ulm (HIU), Helmholtzstraße 11, 89081 Ulm, Germany
‡ Institute for Physical Chemistry, Karlsruhe Institute of Technology, 76131 Karlsruhe, Germany

