Introduction
EBSD is a powerful tool used to study many deformation processes, such as forging, cold rolling, extrusion, and annealing to name a few. Related to the effects of plastic deformations, there are several EBSD-based indicators such as a Kernel Average Misorientation (KAM), Grain Orientation Spread (GOS), Grain Reference Orientation Deviation (GROD) and Geometrically Necessary Dislocation (GND) that can provide information about lattice curvature as a result of the plastic deformation. Most of the aforementioned deformation and heat treatment processes result in materials that are not only plastically deformed but also elastically strained. For example, processes such as shot peening, case hardening and surface hardening can change the surface stress state and increase material fatigue endurance.
In most experimental cases, live EBSD patterns are analysed using Hough based indexing, which has relatively good resolution at high speed. However, Hough based indexing does not provide the necessary angular resolution to accurately determine elastic strain in the crystal lattice. Elastic strain measurements were pioneered in 1990s by using cross-correlation of stored electron backscatter diffraction patterns (EBSPs) to detect subtle shifts between patterns, enabling the quantification of elastic strain to a sensitivity of a few 10-4 and lattice rotations to a few 10-4 radians. This method has led to further developments, resulting in different approaches including bespoke software for strain analysis.
Similar pattern matching techniques, such as in AZtecCrystal MapSweeper, compare stored EBSPs with simulated patterns and improve angular precision by an order of magnitude from 0.5°–0.1° (Hough) to ~0.01° or better, so that more accurate measurements of lattice deformations can be made. Other pattern matching software platforms also offer this strain analysis capability, however they also depend on high resolution EBSPs to achieve the necessary precision for strain analysis. Therefore, data acquisition is slower since high resolution scan settings must be used, data processing takes much longer, and stored data sets can become large and cumbersome to work.
Challenge
The challenge is to develop a more efficient method for strain analysis by utilising high speed EBSD cameras and processed/binned patterns so that HR-EBSD can become a routine part of materials characterisation.
Results
Microhardness Silicon indents are a common method for the controlled deformation of a sample surface and are a standard material when it comes to HR-EBSD measurements. It is easily repeatable because of the accessibility of polished Si wafers and the surface polish allows high-quality EBSD patterns. Data was captured with a Symmetry S2 on a Helios G5 pFIB Dual-beam SEM operated at 20 kV, Speed 1, frame averaging 38, 30 pps.
The improved angular resolution in MapSweeper allows for small changes in EBSPs to be measured compared to a reference pattern so that relative deviatoric strains in the order of x10-4 m/m can be measured (Figure 1). HR-EBSD has long been the standard for elastic strain measurements in EBSD and is used in Figure 2 and 3 as a benchmark for comparison. A key advantage for MapSweeper is that the new super sampling approach allows for the use of binned, processed 8bit patterns.
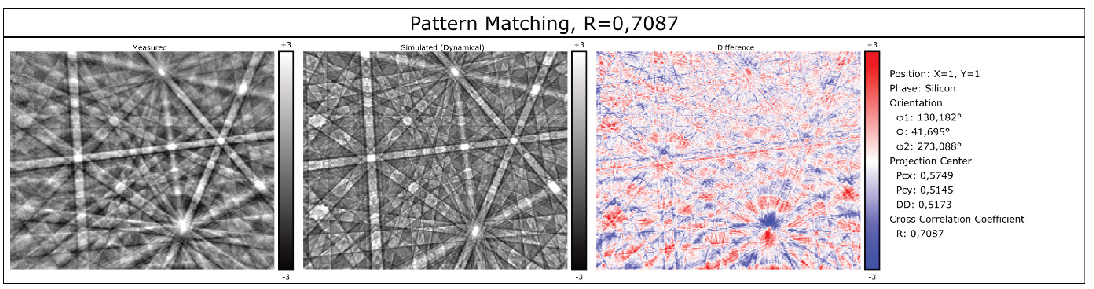 Fig. 1 — MapSweeper pattern matching between measured EBSP (left) and Dynamical simulation of Silicon at 20 kV (centre), difference plotted with a cross-correlation coefficient of R = 0.7087 (right).
The industry-standard benchmark software and MapSweeper were compared using unprocessed 16-bit and processed 8-bit respectively for the same map/dataset. Although MapSweeper can also operate with binned patterns, 622x512 pattern resolution (no binning) with 7x7 super sampling was used for this comparison.
For the precise determination of orientations in HR-EBSD consistent and accurate calibration of the Pattern Centre (PC) is required. MapSweeper has the added functionality of automatically accounting for changes in PC by using multiple calibration points. This means there is no need to separately calculate pixel size by linear regression, which normally limits the distance of strain measurement from the reference point to approximately 100–150 microns for other industry-standard software as noise levels increase further from the reference point.
Figure 2 demonstrates the noise level in the strain free region in both MapSweeper and the industry-standard benchmark software by comparing Area 1, containing the reference pattern and Area 2, furthest from the reference pattern. For Area 1 both MapSweeper and the benchmark software have similar noise, i.e. minimal variation in mean strain. Whereas for Area 2, although both show more variability in mean strain, the variation is much less for MapSweeper. Therefore, MapSweeper is more suitable for strain maps greater than 100 microns. It is noted that MapSweeper also allows for easy, manual selection of the reference point for strain maps without reanalysis.
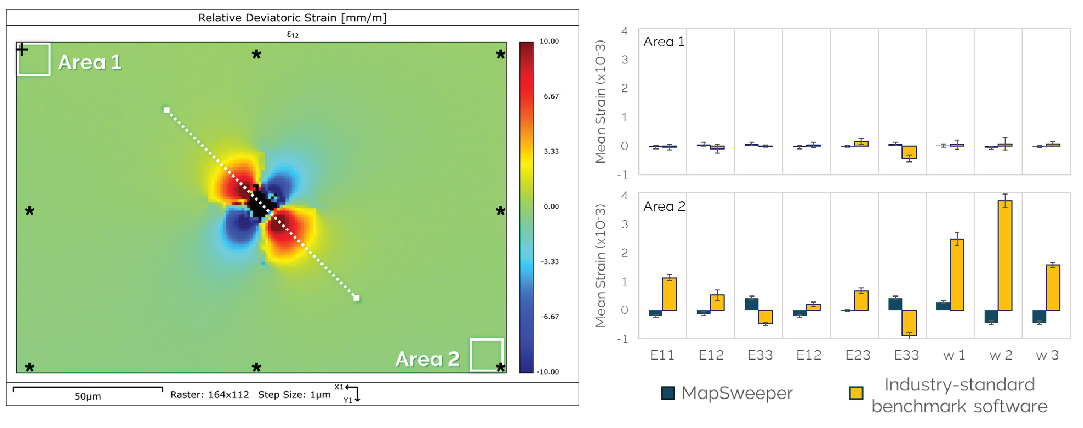 Fig. 2 — ε12 Relative deviatoric strain map of microhardness indent on single crystal Si. Reference pattern for the benchmark software shown as a black cross (+), automated MapSweeper PC calibration patterns shown (*). Mean strain plotted for two smaller areas, Area 1 close to the initial reference pattern and Area 2, furthest from the reference pattern.
Figure 3 plots the relative deviatoric strain for the line profile shown in Figure 2, showing excellent correlation with industry-standard benchmark software for the same stored Si indent EBSPs.
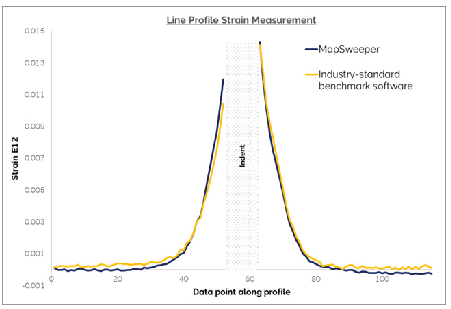 Fig. 3 — ε12 relative deviatoric strain measurements from line profile displayed in Figure 2, showing good correlation between MapSweeper and the industry-standard benchmark solution (NB. No data shown for central indentation area).
Figure 4 displays a map of the relative deviatoric normal strain ε11 (4a) and demonstrates the level of sensitivity and consistency of strain measurements for areas wider than 150 µm on a logarithmic scale.
The K2 map display (4b) is a new map type for AZtecCrystal which plots the norm of the strain tensor and can be used to easily characterise the overall magnitude of the distortion with a single number.
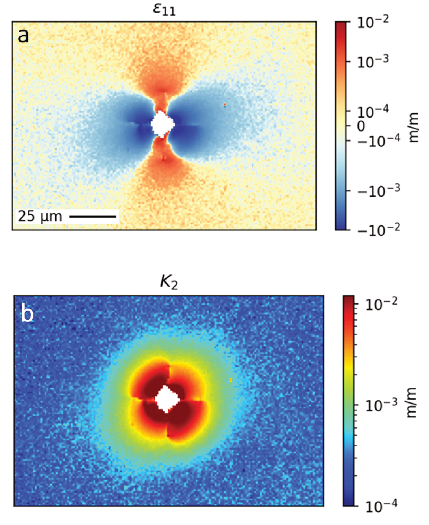 Fig. 4 — a) relative deviatoric strain ε11 on a log scale, b) norm of the strain tensor, K2 (NB. The reference point for relative deviatoric strain is at the top left position.)
Conclusion
MapSweeper Strain Analysis shows good correlation with a much-accepted industry-standard benchmark solution and showcases the reliability of HR-EBSD strain analysis in AZtecCrystal. MapSweeper can produce reliable strain maps using 622x512 pattern resolution 8bit patterns (Speed 1 mode in AZtec), allowing for quicker data acquisition, faster analysis and easier data handling. The added benefit of using multiple calibration points to account for changes in the pattern centre are shown and the ease of selecting/changing the reference pattern is reported. This means that HR-EBSD strain analysis can now be achieved on one platform, making it a routine part of data analysis without the need for HR-EBSPs or dedicated HR-EBSD software.
References
- Schwartz AJ, Kumar M, Adams BL, Field DP, editors. Electron backscatter diffraction in materials science. New York: Springer; 2009 Jan.
- Wilkinson, A. J. (1997). Methods for determining elastic strains from electron backscatter diffraction and electron channelling patterns. In Materials Science and Technology (Vol. 13, Issue 1, pp. 79–84). SAGE Publications. https://doi.org/10.1179/mst.1997.13.1.79
- Wilkinson, A. J., Meaden, G., & Dingley, D. J. (2006). High-resolution elastic strain measurement from electron backscatter diffraction patterns: New levels of sensitivity. In Ultramicroscopy (Vol. 106, Issues 4–5, pp. 307–313). Elsevier BV. https://doi.org/10.1016/j.ultramic.2005.10.001
- Ernould, C., Beausir, B., Fundenberger, J.-J., Taupin, V., & Bouzy, E. (2022). Implementing the homography-based global HR-EBSD/TKD approach. In Advances in Imaging and Electron Physics (pp. 75–114). Elsevier. https://doi.org/10.1016/bs.aiep.2022.07.003
- https://github.com/BYU-MicrostructureOfMaterials/OpenXY
- https://www.hrebsd.com/wp/
- Nolze, G., Jürgens, M., Olbricht, J., & Winkelmann, A. (2018). Improving the precision of orientation measurements from technical materials via EBSD pattern matching. In Acta Materialia (Vol. 159, pp. 408–415). Elsevier BV. https://doi.org/10.1016/j.actamat.2018.08.028
- Winkelmann, A., Trager-Cowan, C., Sweeney, F., Day, A. P., & Parbrook, P. (2007). Many-beam dynamical simulation of electron backscatter diffraction patterns. In Ultramicroscopy (Vol. 107, Issues 4–5, pp. 414–421). Elsevier BV. https://doi.org/10.1016/j.ultramic.2006.10.006
- Winkelmann, A., Nolze, G., Cios, G., Tokarski, T., Bała, P., Hourahine, B., & Trager-Cowan, C. (2021). Kikuchi pattern simulations of backscattered and transmitted electrons. In Journal of Microscopy (Vol. 284, Issue 2, pp. 157–184). Wiley. https://doi.org/10.1111/jmi.13051
- Winkelmann, A., Cios, G., Perzyński, K., Tokarski, T., Mehnert, K., Madej, Ł., & Bała, P. (2025). Simulation-based Super-Resolution EBSD for Measurements of Relative Deformation Gradient Tensors (Version 1). arXiv. https://doi.org/10.48550/ARXIV.2502.11628
- Winkelmann, A., Nolze, G., Cios, G., Tokarski, T., & Bała, P. (2020). Refined Calibration Model for Improving the Orientation Precision of Electron Backscatter Diffraction Maps. In Materials (Vol. 13, Issue 12, p. 2816). MDPI AG. https://doi.org/10.3390/ma13122816
Acknowledgements
With thanks to Grzegorz Cios, Academic Centre for Materials and Nanotechnology, AGH University of Krakow, Krakow, Poland and Aimo Winkelmann, ST-Development.

