Introduction
One of the great strengths of nuclear magnetic resonance (NMR) spectroscopy is the wide range of pulse sequences available, and hence the different spectra and information which may be obtained.
The basic one-dimensional NMR spectrum comprises a single radio-frequency (RF) pulse followed by acquisition of the NMR signal as a free induction decay (FID) and a Fourier transformation to give the spectrum. By combining multiple RF pulses and varying the delays between them, it is possible to build up multi-dimensional spectra which provide additional information about the sample.
In this application note we compare the two-dimensional ¹H-¹H NMR spectra for two structural isomers of C₆H₁₀O₂, ethyl crotonate and trans
-2-hexenoic acid (Figure 1), to show the differences between COrrelation SpectroscopY (COSY) and TOtal Correlation SpectroscopY (TOCSY).

Fig. 1 — Molecular structures of the C₆H₁₀O₂ isomers, Ethyl Crotonate (left) and trans
-2-Hexenoic Acid (right)¹H-¹H Two-Dimensional NMR Spectroscopy
An NMR spectrum is produced by performing a discrete Fourier Transformation (dFT) on a series of time domain data points, measured with a particular time interval between each point. It does not matter to the dFT whether the points have been collected in 'real time' or if the series of points have been indirectly constructed. This fact is the basis for two-dimensional (2D) NMR experiments where one dimension is collected in the usual direct manner and a second dimension is constructed in a stepwise manner.
The sequence diagrams associated with two two-dimensional NMR experiments, the COSY and TOCSY, are shown in Figure 2. Initially the nuclei are excited with a single radio-frequency (RF) pulse to generate a non-equilibrium state. This state is allowed to evolve for a time t₁, before being subjected to further RF manipulation (a single RF pulse for the COSY, a spin-lock for the TOCSY). Finally, the NMR signal is recorded (for a time t₂). This process is repeated n times with the value of t₁ being incremented each step, such that the final data is an array of n NMR signals differing only through the duration of the evolution time, t₂. This array then undergoes dFT with respect to both the times t₁ and t₂ to produce a two-dimensional NMR spectrum.
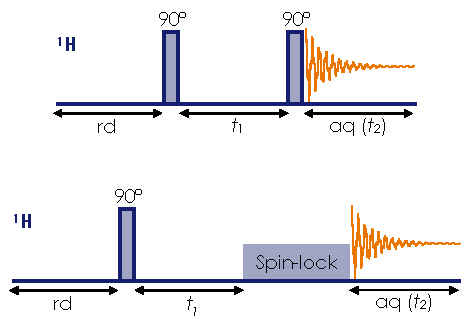
Fig. 2 — COSY (top) and TOCSY (bottom) pulse sequences
COSY
Homonuclear COrrelation Spectroscopy (COSY) is the simplest two-dimensional NMR experiment, and correlates the chemical shifts of spins that share a mutual J-coupling. Since J-coupling is an interaction between nuclei that is mediated through chemical bonds, in general this coupling gets weaker as nuclei are separated by an increasing number of bonds. As a result, the ¹H-¹H COSY spectrum correlates hydrogen nuclei on adjacent carbons or, in the case of multiply bonded carbons, the next nearest carbons. The method is most commonly used to determine the underlying structure of the carbon backbone in an organic molecule.
All signals that appear in the one-dimensional spectrum will show a peak along the diagonal in the COSY spectrum. The cross-peaks (off diagonal peaks) show which hydrogens share a J-coupling through the correlation between the two chemical shifts.
For ethyl crotonate (Figure 3), the two ethyl signals 4-CH₂ and 5-CH₃ are shown to couple together through a three-bond (H–C–C–H) coupling. While the three signals from the crotonate group, 1-CH₃, 2-CH & 3-CH, couple through three- (H–C–C–H, H–C=C–H) or four- (H–C–C=C–H) bond interactions. (Four-bond couplings are usually fairly weak and not observed; in this case the double bond between 2-CH & 3-CH ensures the coupling between 1-CH₃ & 3-CH is large enough to observe, ⁴JHH = 1.6 Hz.)
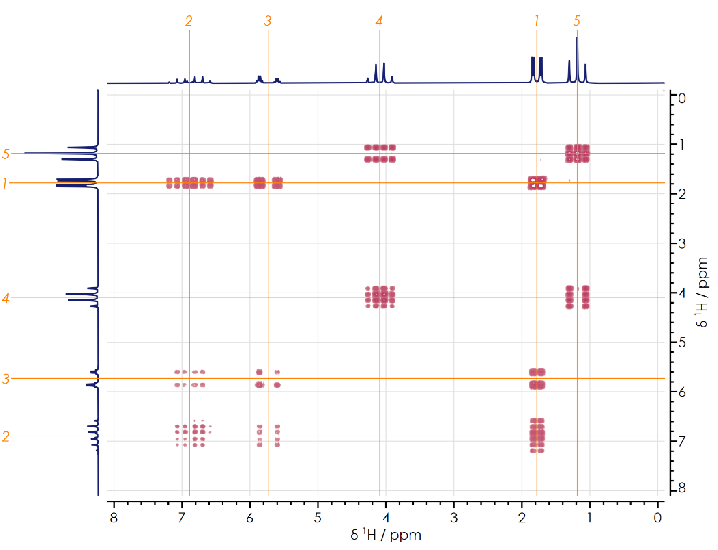
Fig. 3 — ¹H-¹H COSY spectrum of Ethyl Crotonate
While for trans
-2-hexenoic acid (Figure 4), the five signals from the hydrocarbon backbone, a to e, all show peak splitting arising from J-coupling to nearby hydrogens. (There is a sixth signal in the full trans
-2-hexenoic acid spectrum from the carboxylic acid group; this does not interact with any other protons and occurs at a chemical shift (δH) of around +12 ppm.) The COSY spectrum reveals the three-bond coupling between a-CH₃ & b-CH₂, b-CH₂ & c-CH₂, c-CH₂ & d-CH and d-CH & e-CH. It also shows the four-bond coupling between c-CH₂ & e-CH. (As for the ethyl crotonate, this is due to the double bond between d-CH & e-CH.)
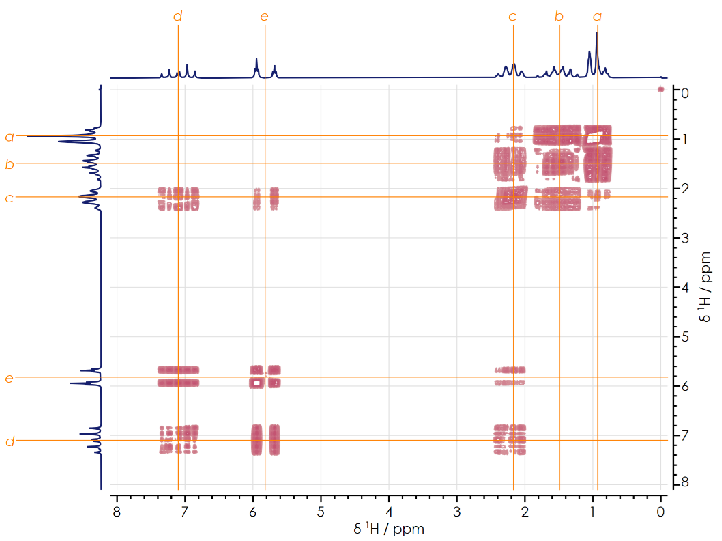
Fig. 4 — ¹H-¹H COSY spectrum of trans
-2-Hexenoic AcidTOCSY
TOtal Correlation SpectroscopY (TOCSY) is a homonuclear two-dimensional experiment similar to COSY, in which the J-coupling between two hydrogen nuclei manifests as a cross peak in the spectrum. Unlike COSY, however, the detection of the coupled spins is not limited to nearest neighbours. The TOCSY experiment exploits isotropic mixing which occurs during spin-locking to produce cross peaks between all hydrogen nuclei that form part of an unbroken chain of coupled spins.
This can be illustrated by considering the TOCSY spectra for ethyl crotonate and trans
-2-hexenoic acid, and comparing them with the corresponding COSY spectra discussed in the previous section.
If we compare the COSY (Figure 3) and TOCSY (Figure 5) spectra of ethyl crotonate, we can see that ethyl crotonate comprises two separate chains of spins: the crotonyl group (1-CH₃, 2-CH & 3-CH) and the ethyl group (4-CH₂ and 5-CH₃). The lack of cross peaks between the two sets of spins confirms the presence of nuclei which effectively breaks the J-coupling chain — in this case those of the ester {–C(O)O–} linkage.
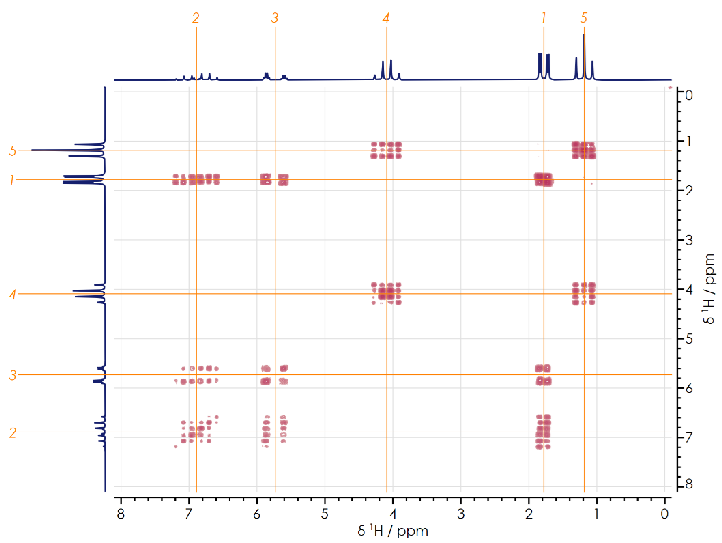
Fig. 5 — ¹H-¹H TOCSY spectrum of Ethyl Crotonate
In contrast, the TOCSY spectrum of trans
-2-hexenoic acid (Figure 6) shows coupling between all pairs of hydrogen nuclei, as the hydrocarbon backbone (a to e) comprises a single unbroken chain of coupled spins.
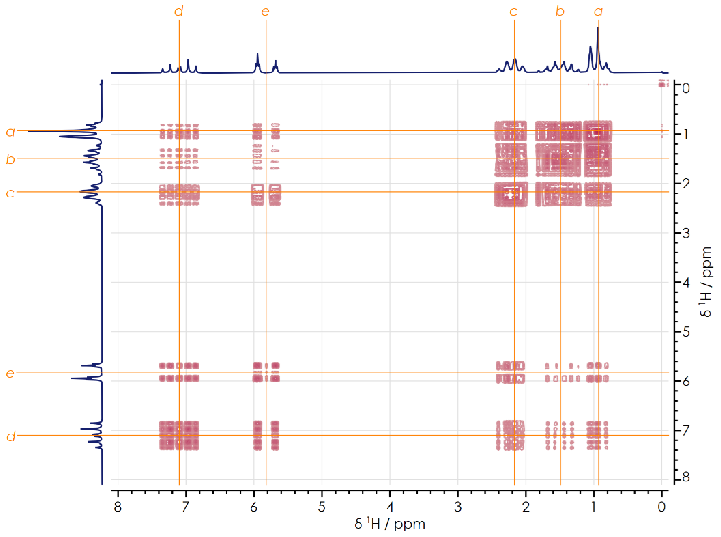
Fig. 6 — ¹H-¹H TOCSY spectrum of trans
-2-Hexenoic AcidSummary
COSY and TOCSY are only two of the commonly used one- and two-dimensional NMR experiments used for structural elucidation of unknown chemicals. The Oxford Instruments X-Pulse Broadband Benchtop NMR Spectrometer comes with three-axis pulse-field gradients as standard, permitting the more efficient and effective gradient-selective versions of two-dimensional correlation experiments to be used. Combined with the optional twenty-five position autosampler, efficiency and throughput can be maximised.

